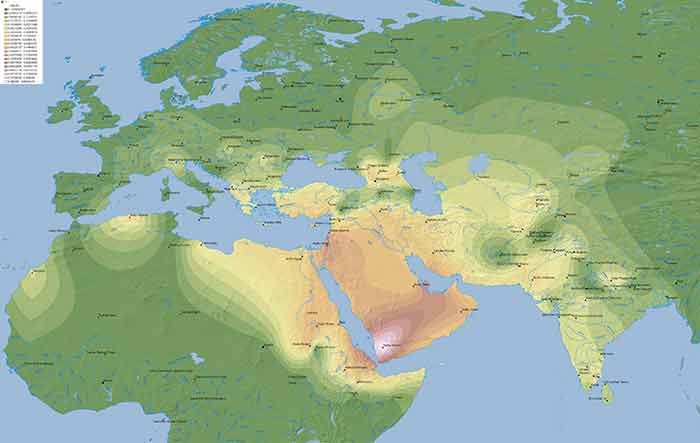
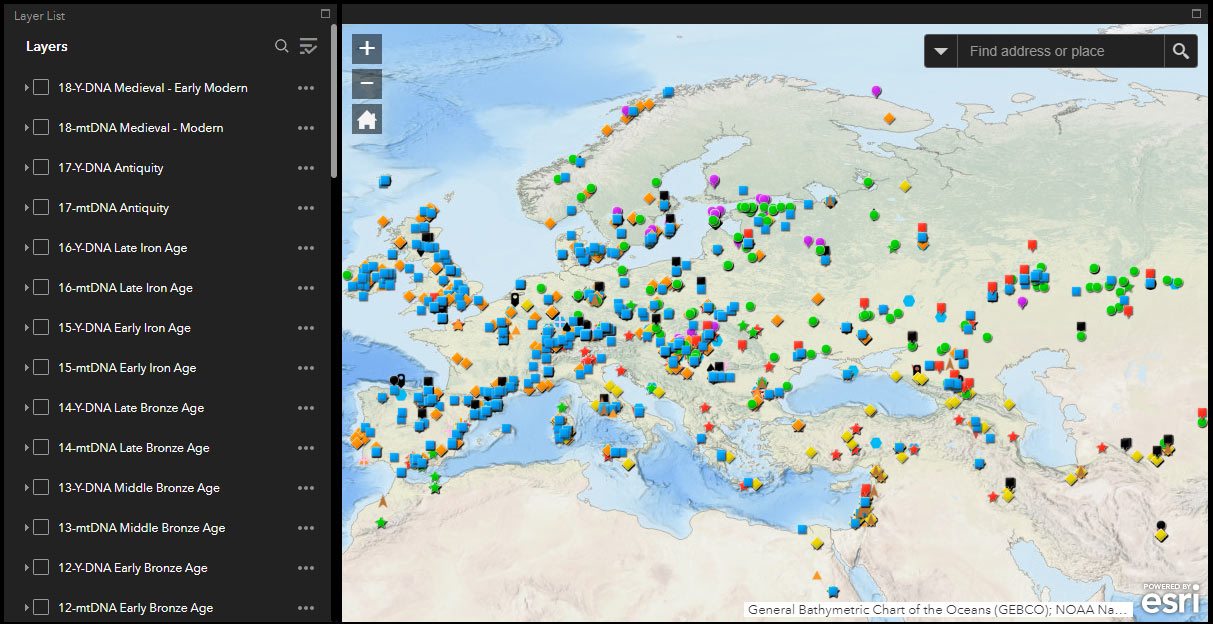
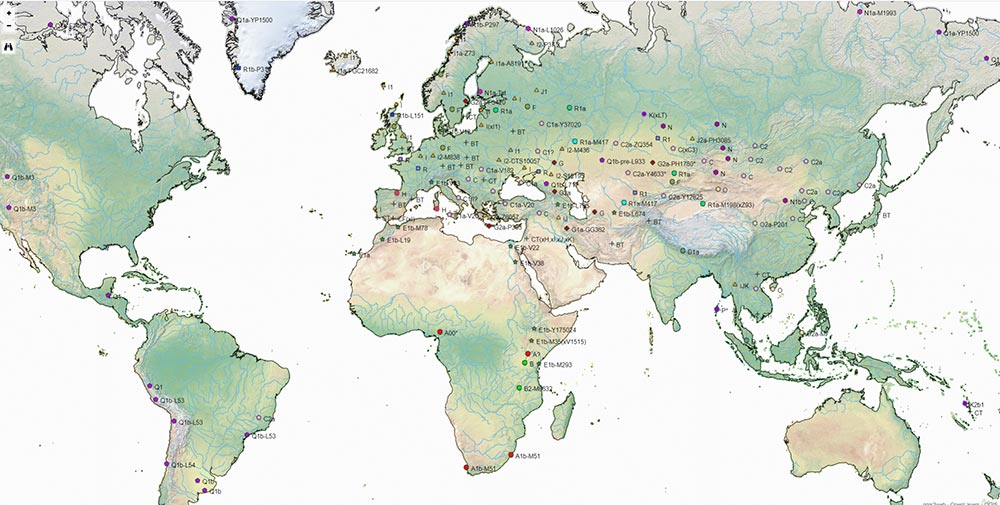
These are maps of distribution of ancient and modern haplogroups and their main subclades:
You can reuse and modify the images posted here as you see fit. If you can, please cite the corresponding book and – especially if you use these high-quality images – the specific page of this website (http://indoeuropeen.eu/) as the source. Thank you.
 This work is licensed under a Creative Commons Attribution 3.0 Unported License.
Ancient distribution
ArcGIS Online
ArcGIS Online offers the possibility of publishing my collected Ancient Y-DNA and mtDNA data layers over my prehistoric map image layers with predetermined themes for ease of use. You can read more about instructions for use of the software.
NOTE. The easier to remember domain name haplogroup.info can be used to access both, this ArcGIS Online map and the Google Drive folder with the dataset.
Static GIS maps
This is the previous post explaining the available dynamic and static map files for quick reference of Y-DNA and mtDNA haplogroups of ancient samples:
Modern distribution
- Statistics: maps use natural neighbour interpolation, unless otherwise expressly stated.
- Classification: color gradient is dependent on the data, with the maximum value (white colour) corresponding to the maximum value attested for the specific haplogroup. Use the legend for detailed information.
- Scale is usually 1:30000000.
- Data used comes from the latest reports at the time of publication, referenced at the top of the page. For the specific date of the map, look at the URL of the full-sized map.
Haplogroup R1b-M269
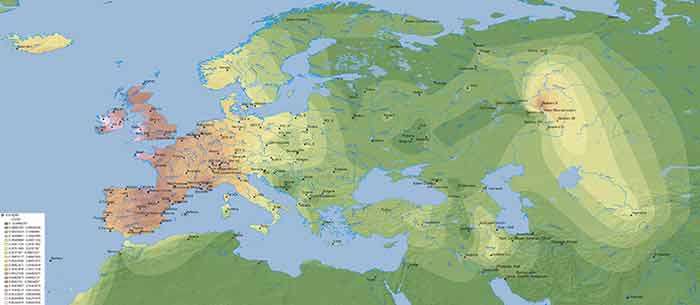
Haplogroup R1a-M417
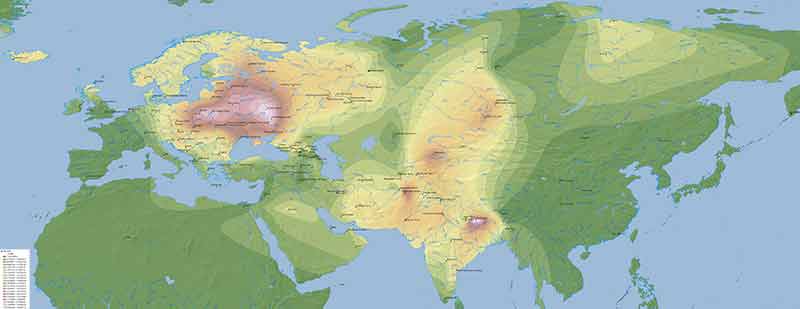
Haplogroup R1-M173, R2-M479
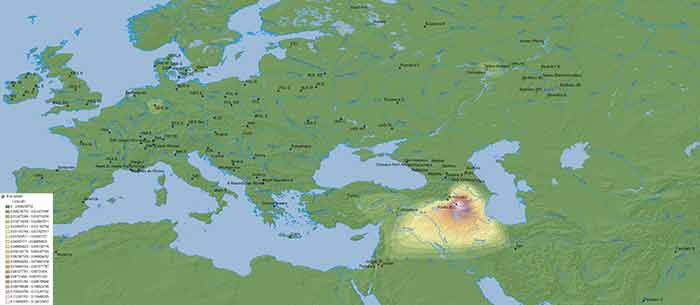
Haplogroup N1a-TAT

Haplogroup Q-M242
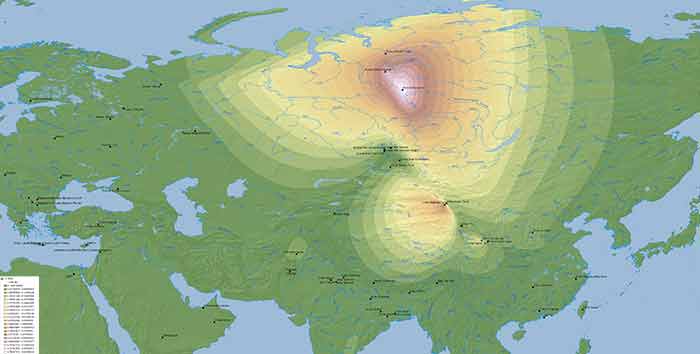
Haplogroup I-M170
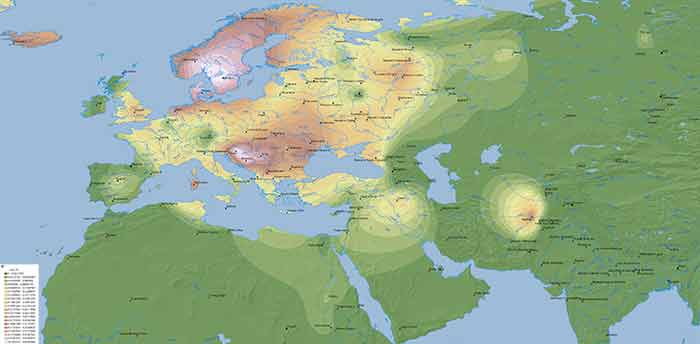
Haplogroup E-M96
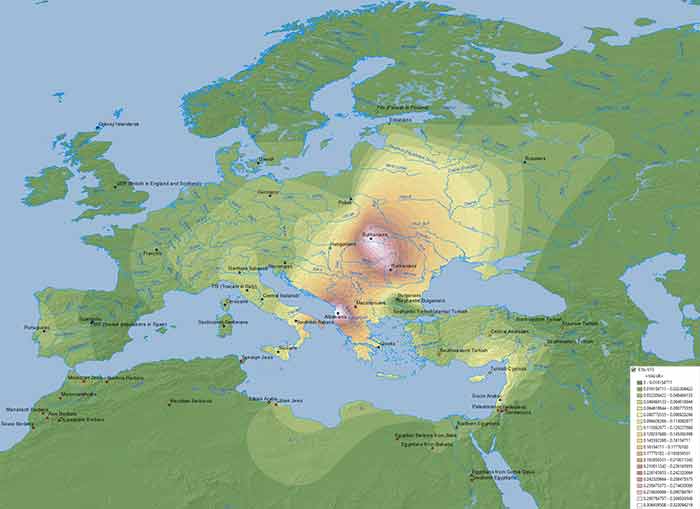
Haplogroup G-M201
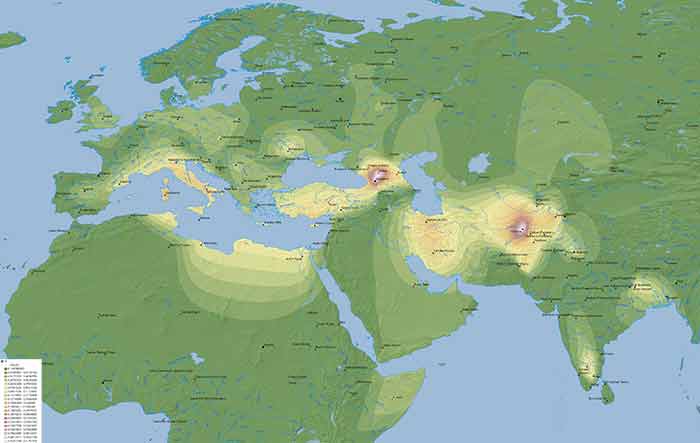
Haplogroup J-M304
